
EXPERIENCE AT A GLANCE
A Track Record Shaped by Real-World Ownership


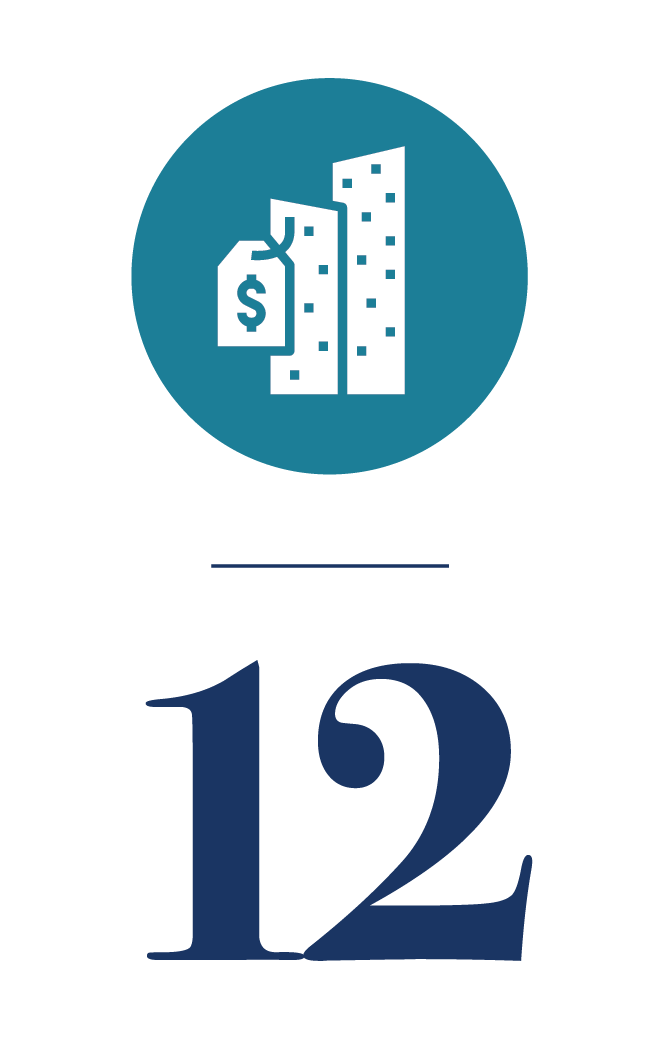
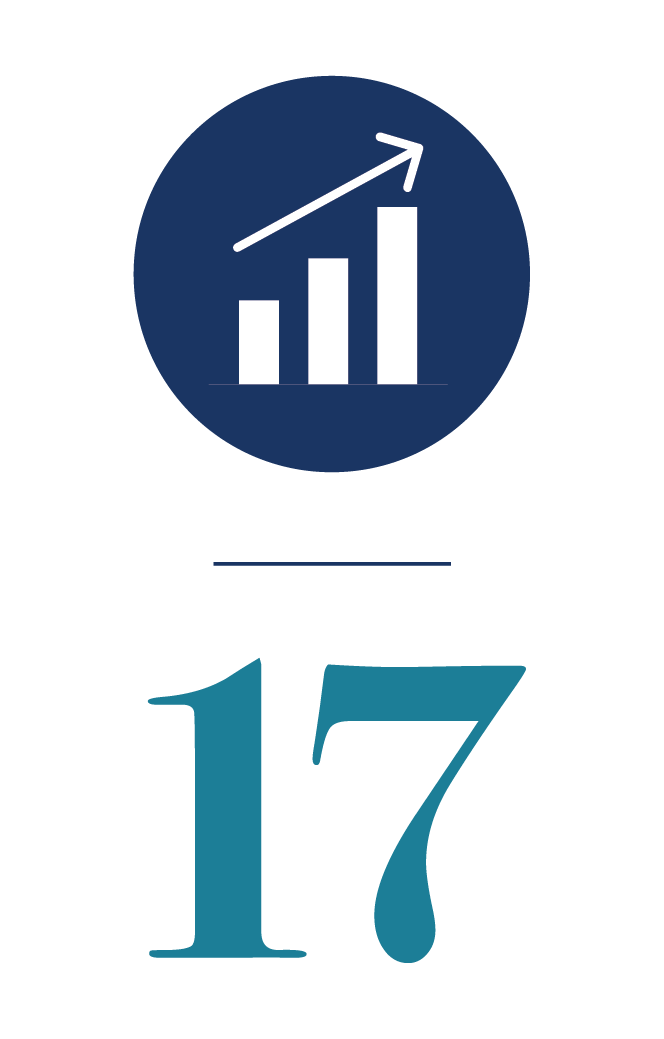
GROUND UP DEVELOPMENT PROJECTS
COMPLETED
ACQUISITIONS
REFINANCING VALUATION GAINS EXCEEDING ORIGINAL BASIS
FULLY REALIZED ASSET SALES
INVESTMENT TIMELINE
17+ Years of Real Estate Investing
On-going Investments
Sold Investments
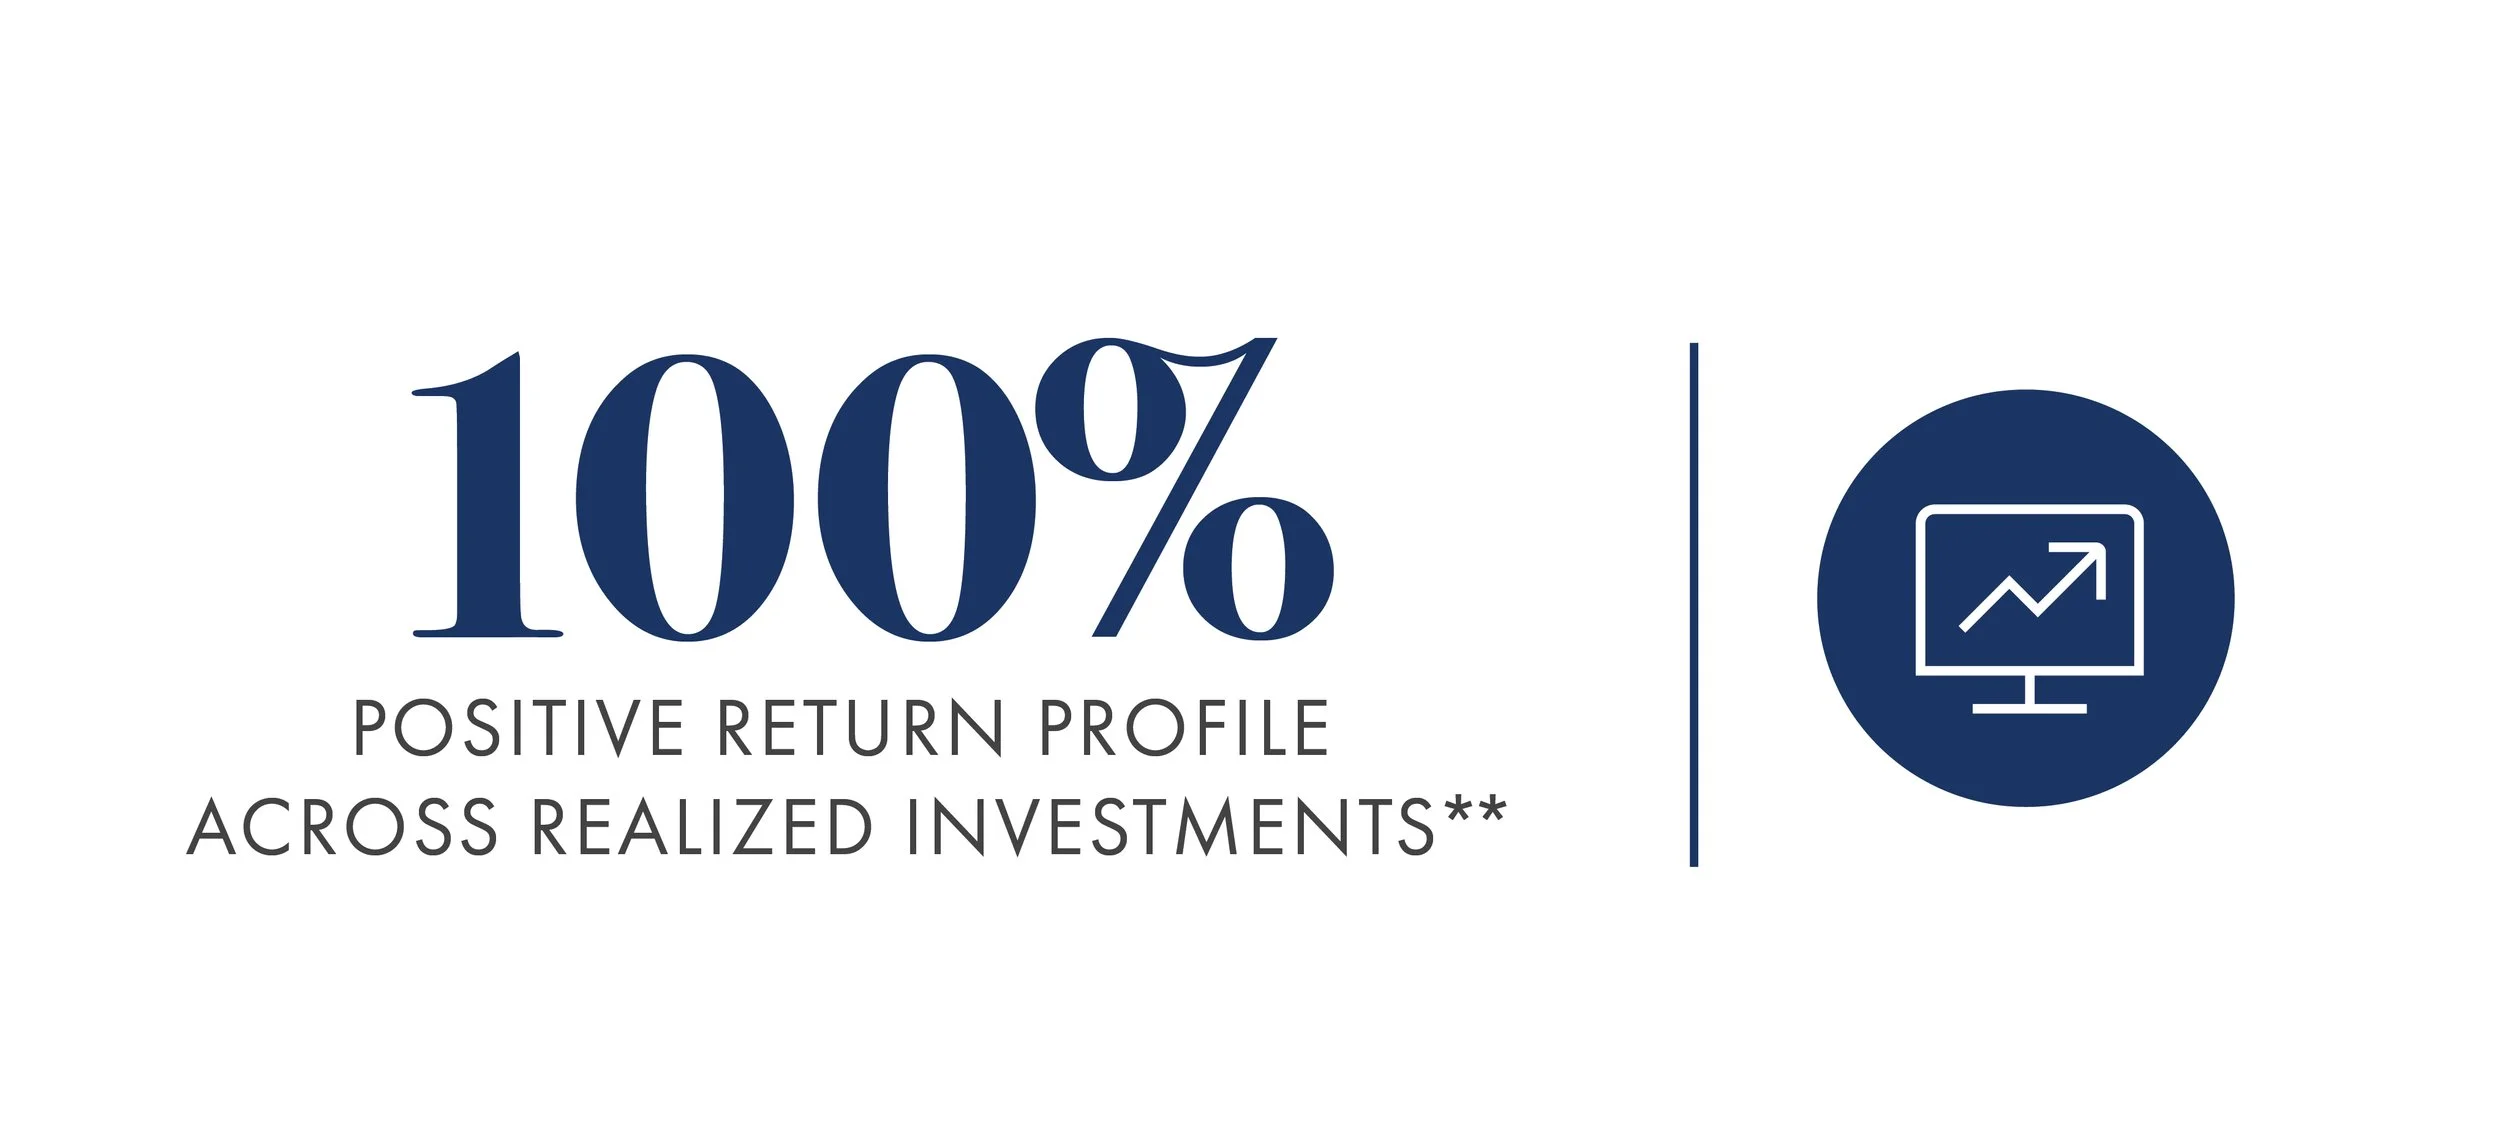
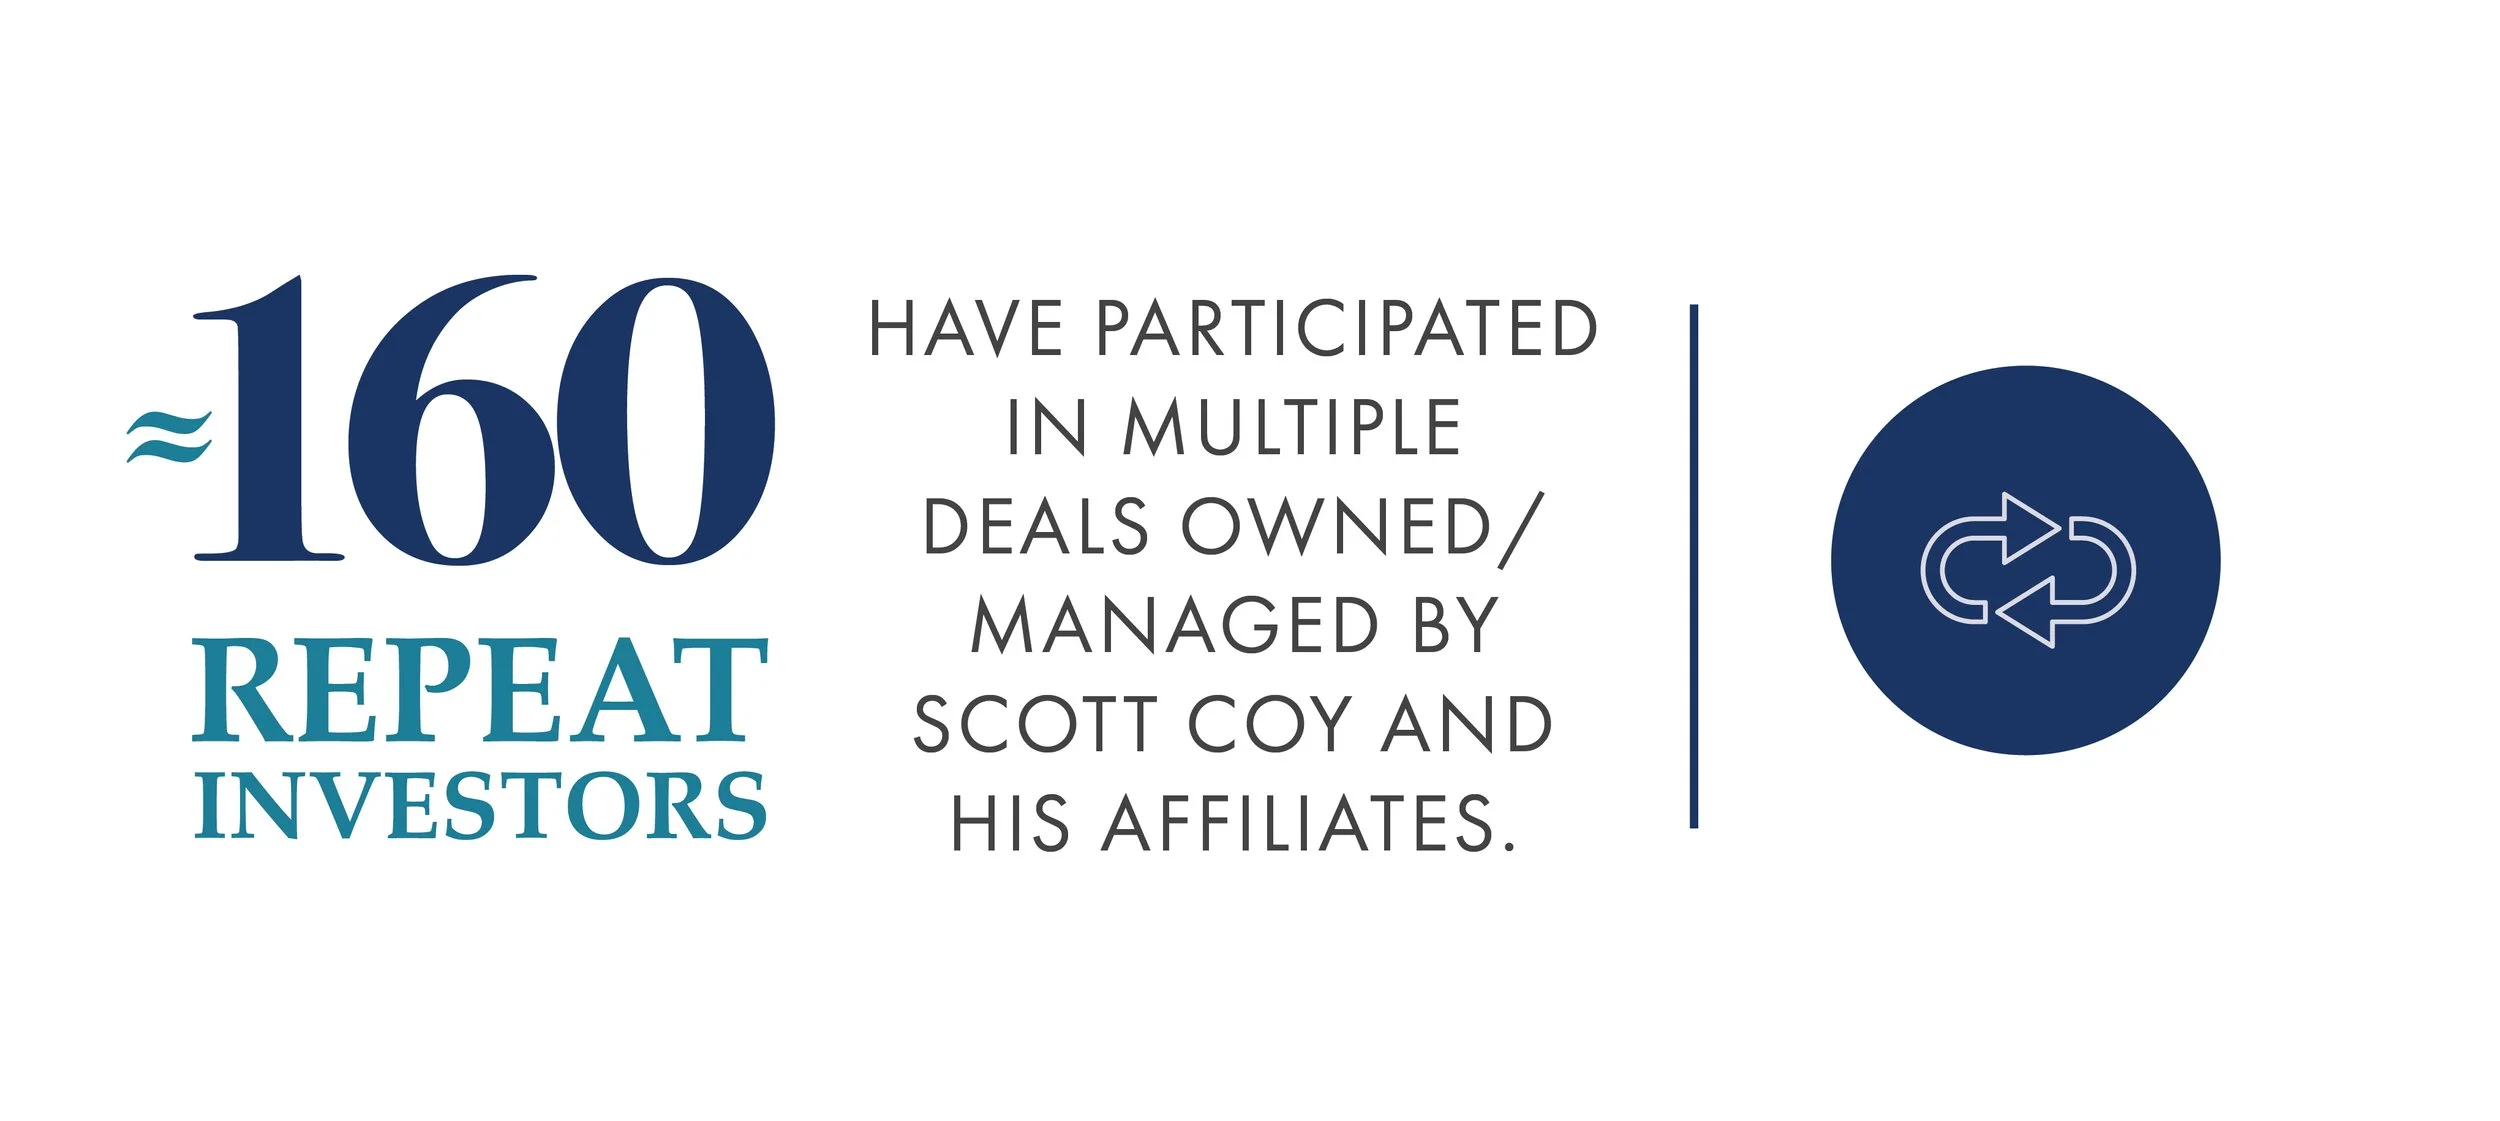
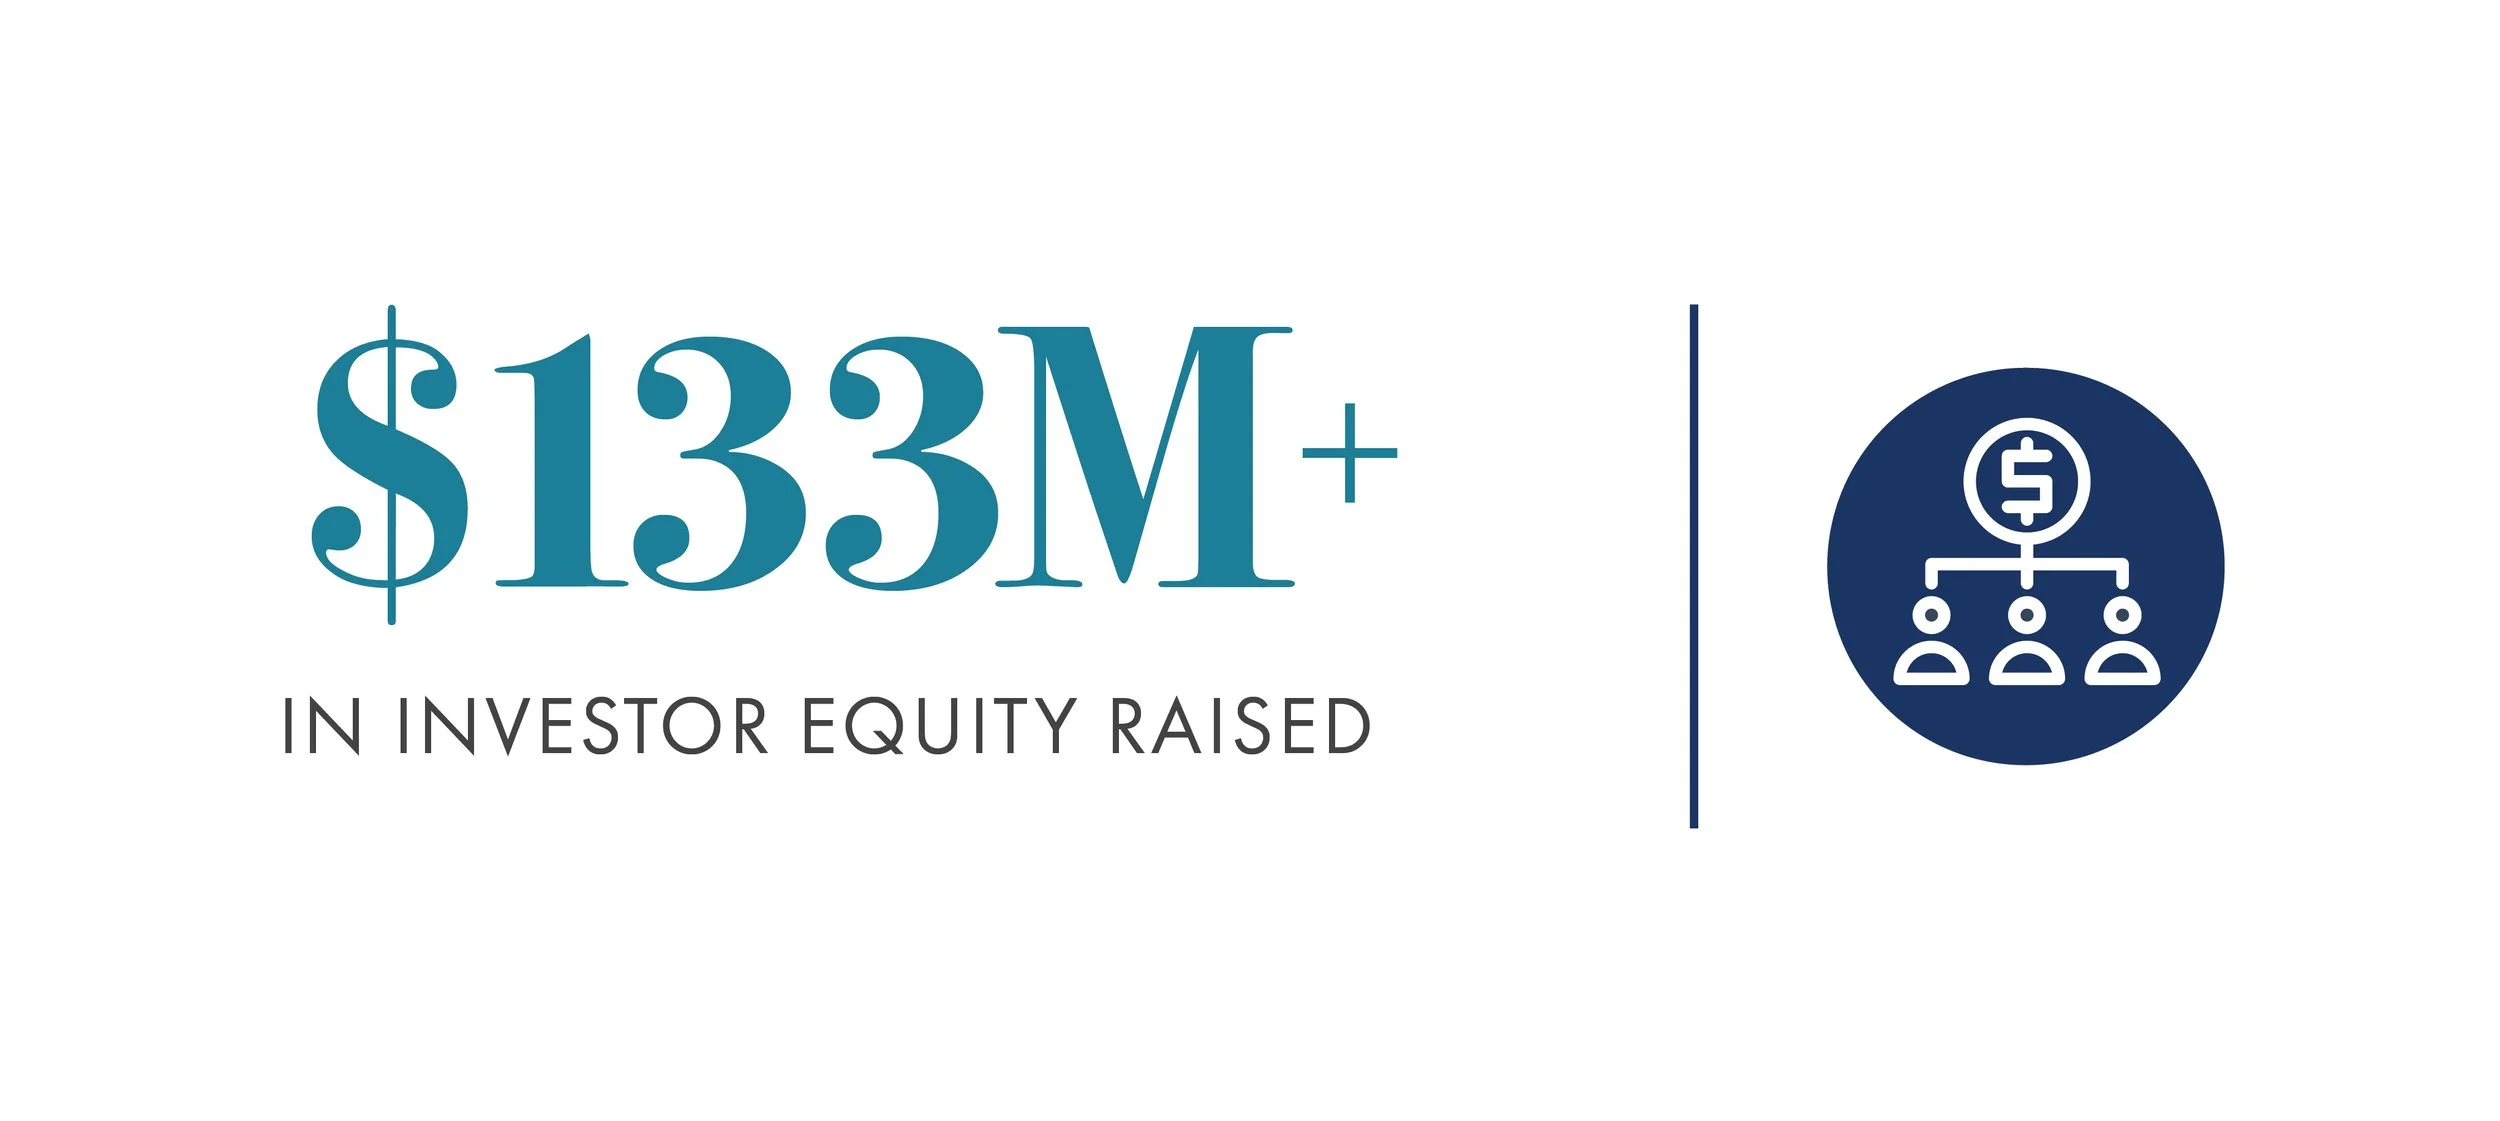
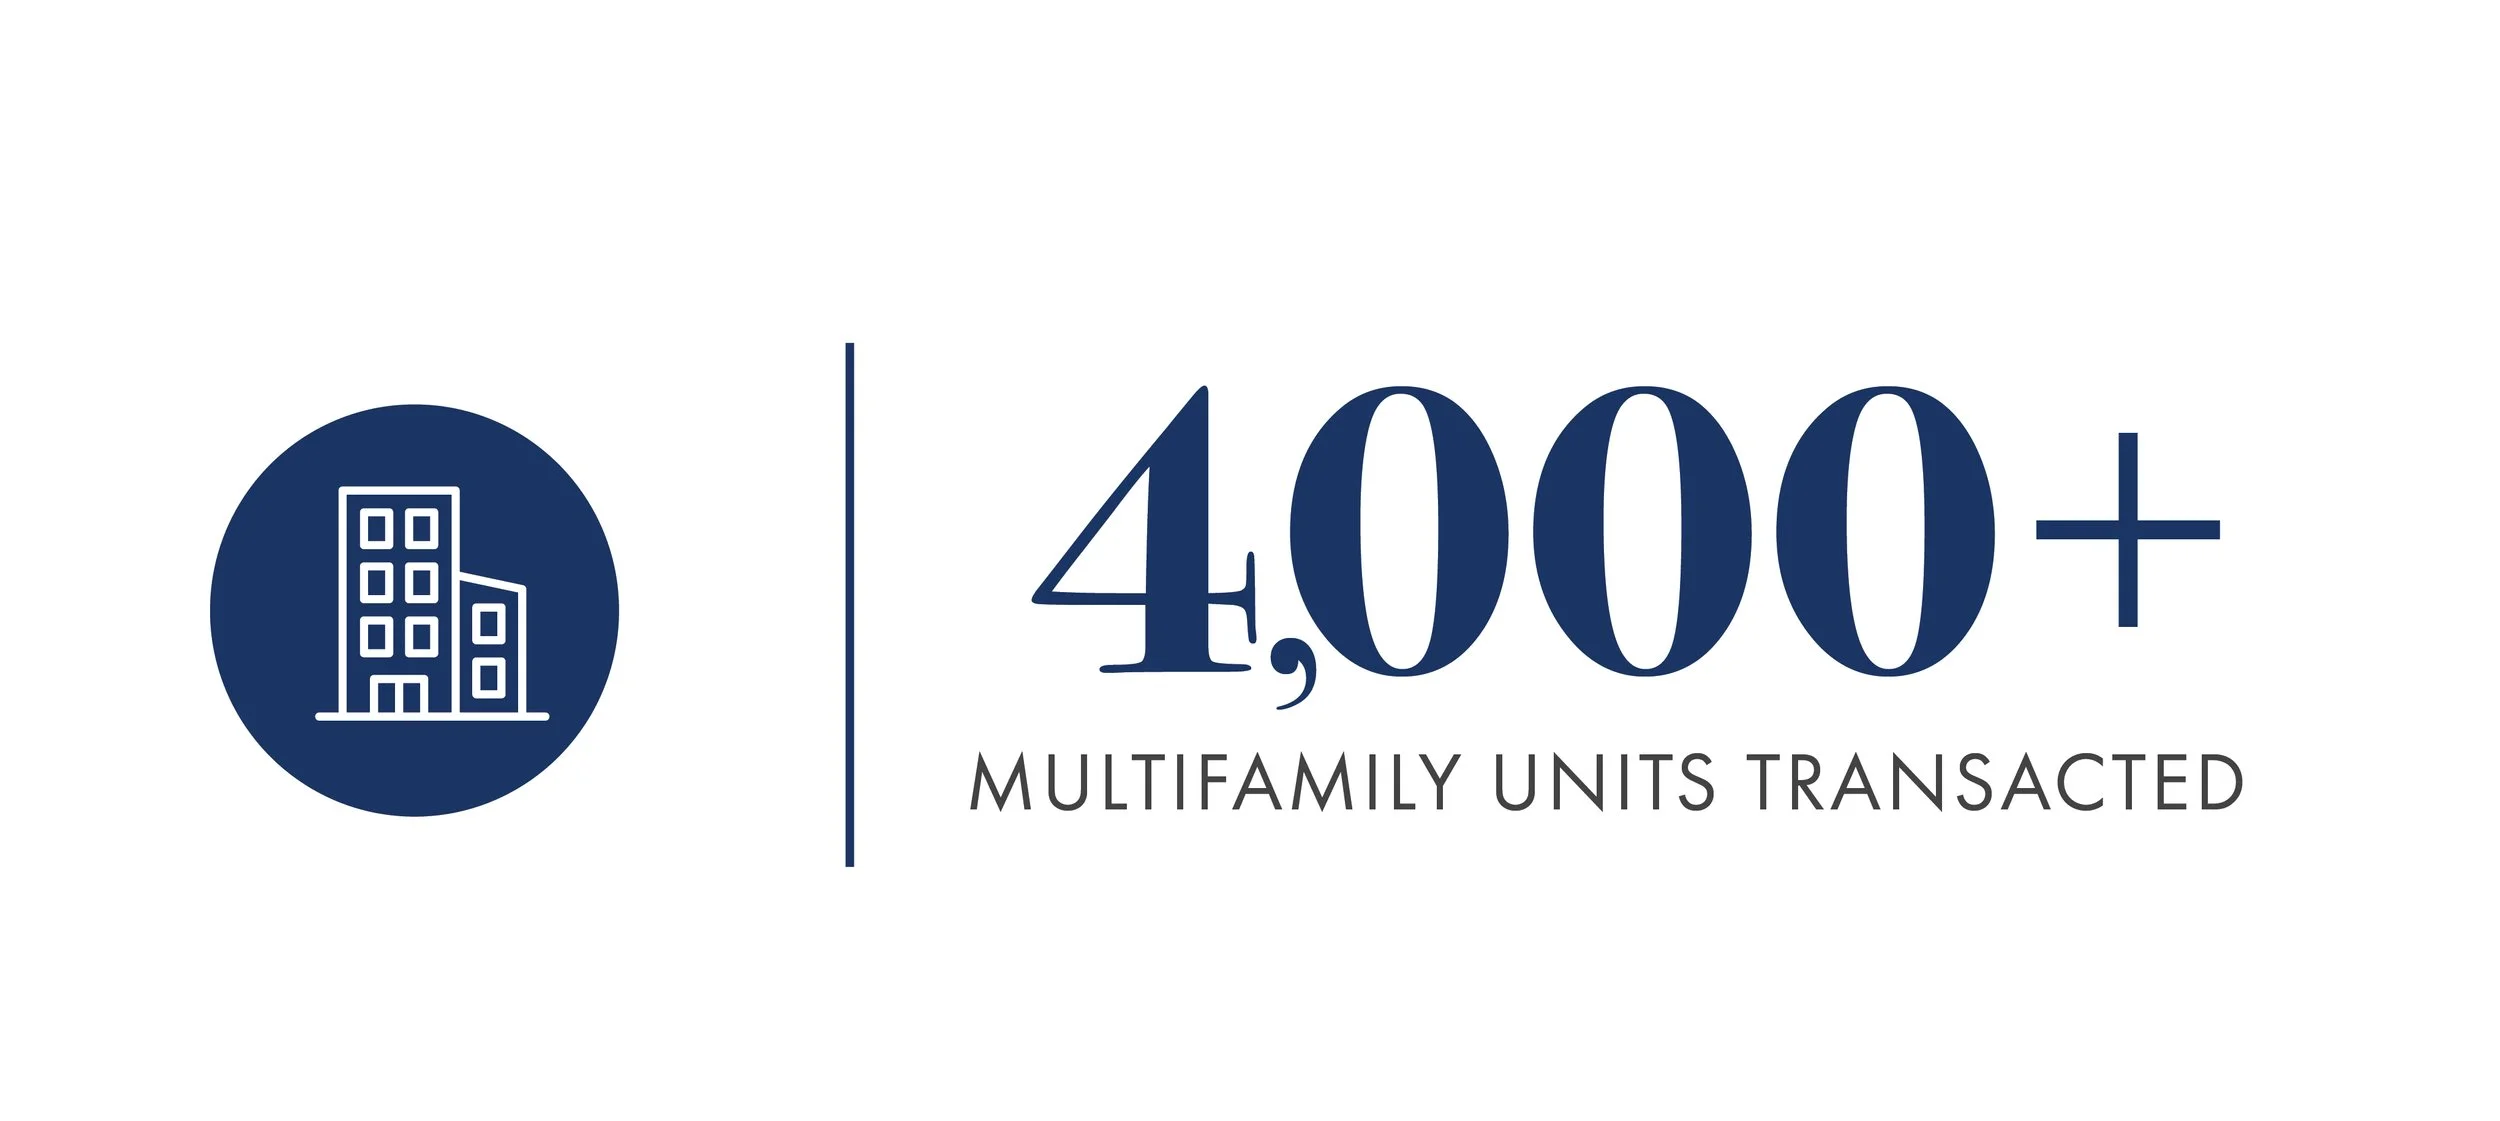

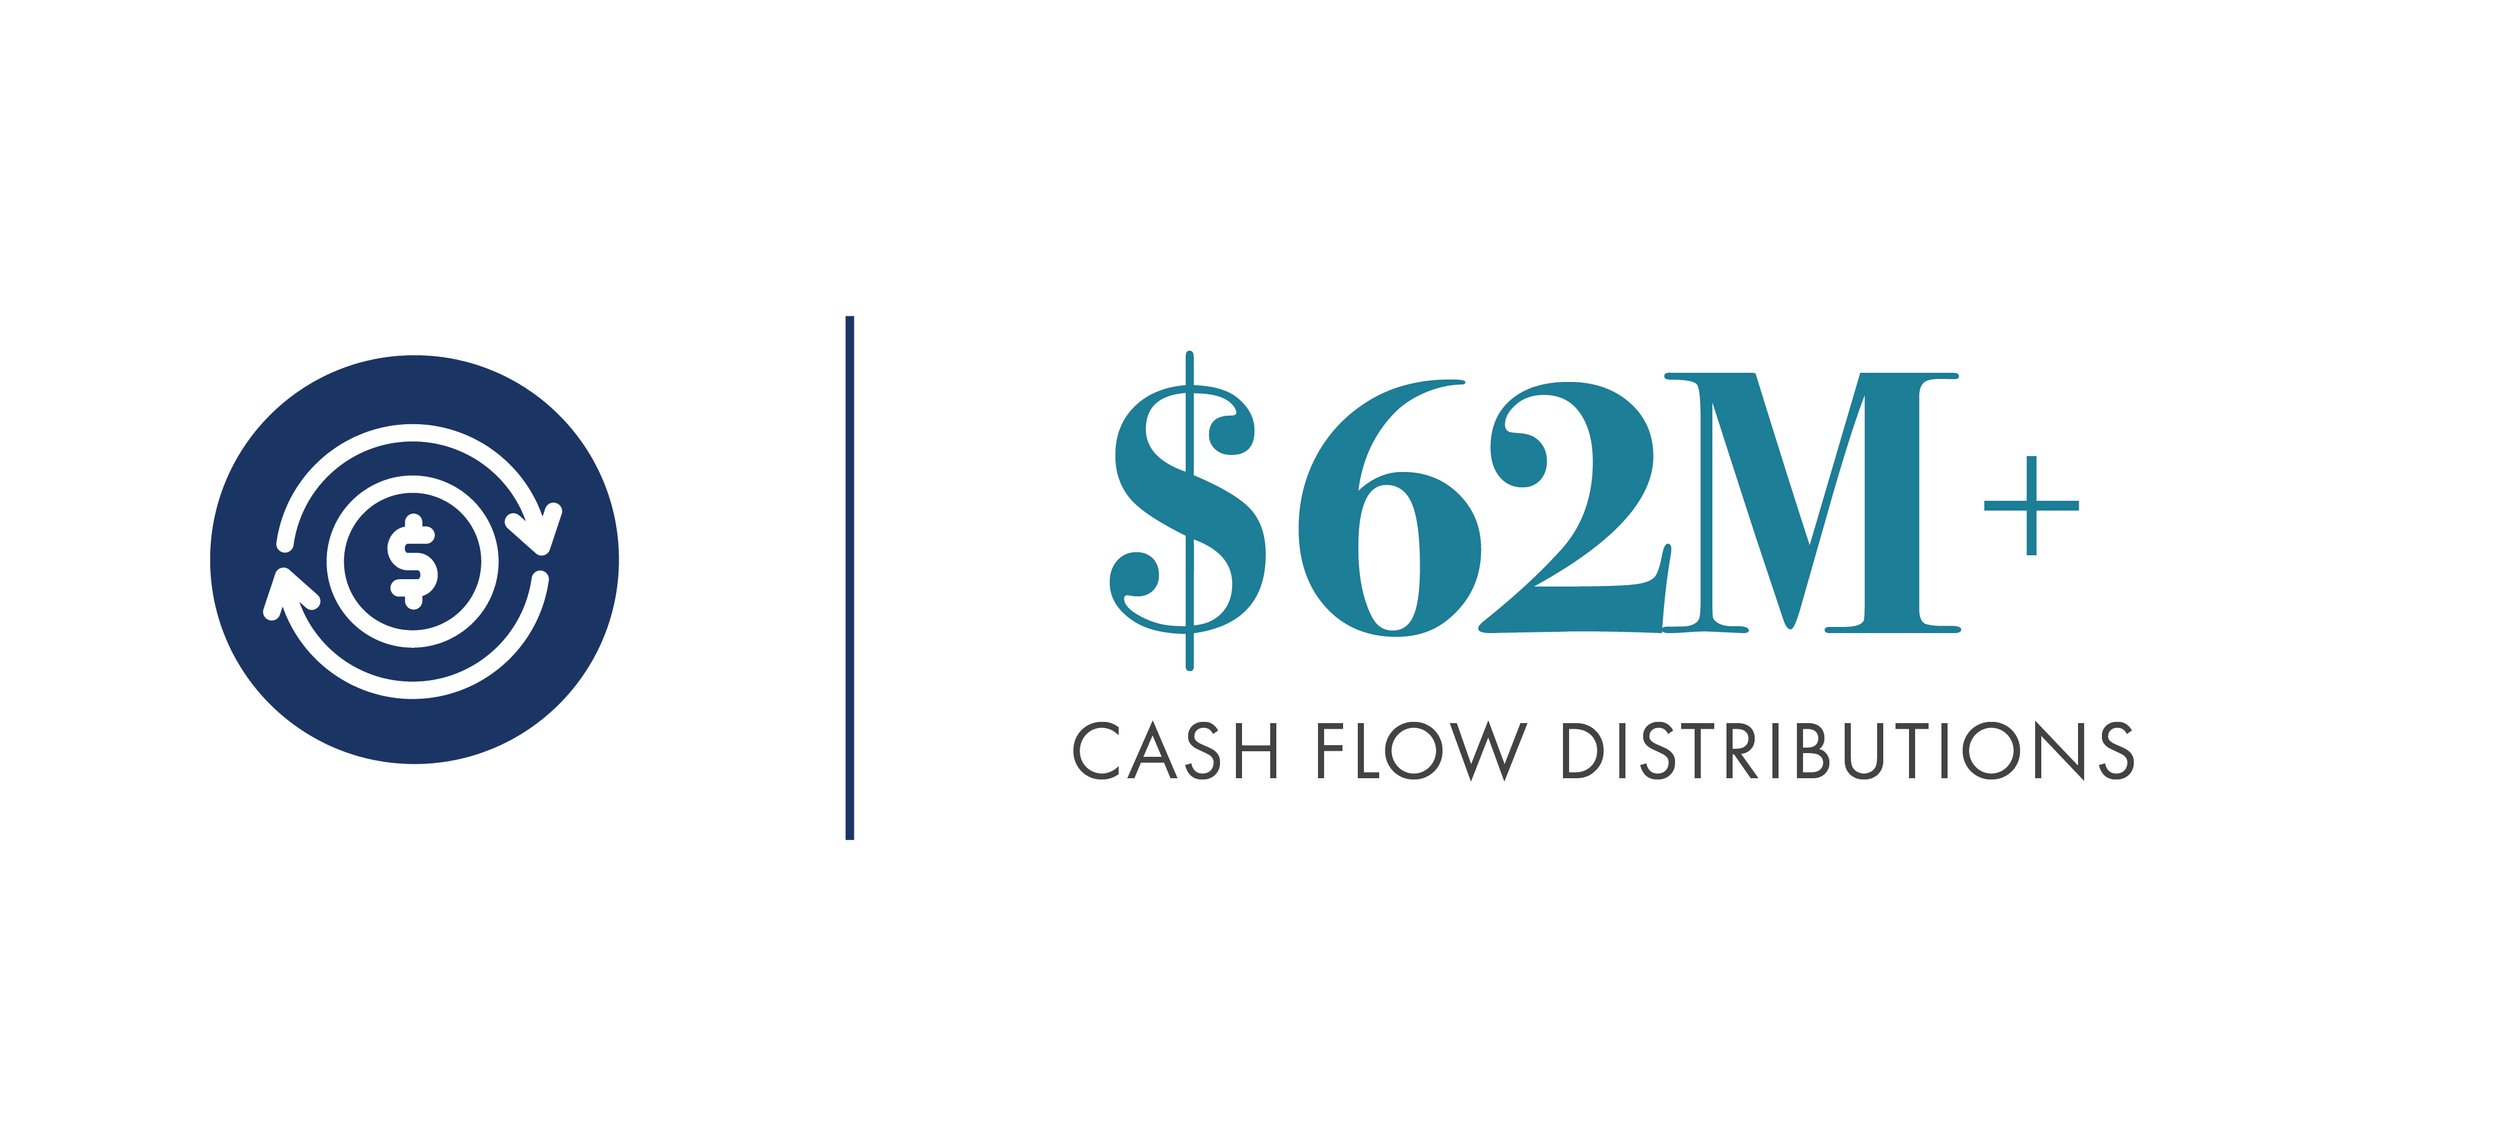
**Refers to investments that have been fully exited and for which investment performance can be calculated based on realized proceeds. A positive return profile indicates that in the aggregate, realized investments generated proceeds in excess of invested capital. Past performance is not indicative of future results.
PERFORMANCE HISTORY
A Closer Look at Investment Performance
Sold Projects
| Project Status |
Project | Acquisition Date |
Disposition Date |
Purchase Price2 |
Investor Funds2 |
Returned Capital Refinance / Sale2 |
Investor Earnings2,3 |
Cumulative TWR2,4 |
Annualized TWR2,4 |
|---|---|---|---|---|---|---|---|---|---|
| Sold1 | Oakmont Equity V, LLC | Sept. 2011 | April 2015 | $18,900,000 | $5,300,000 | $5,300,000 | $3,864,213 | 85.37% | 19.95% |
| Timber Creek Investments, LLC | Dec. 2012 | June 2018 | $6,650,000 | $2,500,000 | $2,500,000 | $1,727,274 | 91.72% | 12.26% | |
| Lorain Investments, LLC | March 2013 | June 2018 | $2,050,000 | $780,000 | $780,000 | $294,593 | 42.72% | 6.90% | |
| Andover Park Investments, LLC | Oct. 2014 | Nov. 2018 | $27,000,000 | $6,400,000 | $6,400,000 | $3,187,490 | 61.67% | 12.41% | |
| Remington Woods Investments, LLC | May 2016 | Aug. 2018 | $35,000,000 | $8,850,000 | $8,850,000 | $1,547,392 | 18.77% | 7.48% | |
| Wesbury Park Investments, LLC | April 2015 | Dec. 2018 | $14,300,000 | $4,000,000 | $4,000,000 | $1,083,045 | 30.51% | 7.40% | |
| Arbors Investments, LLC | Aug. 2015 | March 2020 | $22,000,000 | $5,000,000 | $5,000,000 | $2,384,973 | 58.89% | 10.43% | |
| Turnberry Creek Investments, LLC | Oct. 2013 | March 2020 | $7,200,000 | $2,053,000 | $2,053,000 | $1,308,449 | 85.78% | 10.11% | |
| Tuttle Investments, LLC | March 2017 | Aug. 2022 | $32,800,000 | $9,000,000 | $9,000,000 | $4,767,719 | 71.52% | 10.50% | |
| Denton Investments, LLC | 2020 | Sept. 2023 | — | $13,379,000 | $13,379,000 | $4,463,447 | 37.80% | 24.17% | |
| Weatherford Investments LLC | 2020 | Sept. 2023 | — | $16,020,000 | $16,020,000 | $3,580,836 | 30.12% | 15.41% | |
| TOTAL | $165,900,000 | $73,282,000 | $73,282,000 | $28,209,430 | — | — | |||
-
1. These figures reflect the historical performance of an investment in a project from its acquisition date through the report date. Past performance is not indicative of, and does not guarantee future results.
2. The figures appearing in this column have not been independently audited or verified and should not be viewed as an indication of future performance of any other investment.
3. Investor Earnings represent the total earnings distributed to investors as of the report date. Quarterly distributions are generally made following the end of each quarter and are recognized in this report as of the date paid.
4. Cumulative Time-Weighted Return (TWR) and Annualized Time-Weighted Return figures are calculated as of the report date and reflect only distributions paid through that date.
Ongoing Projects
As of September 30, 2026
| Project Status |
Project | Acquisition Date |
Disposition Date |
Purchase Price3 |
Investor Funds3 |
Returned Capital Refinance / Sale3 |
Investor Earnings1,3 |
Cumulative TWR3,6 |
Annualized TWR3,6 |
|---|---|---|---|---|---|---|---|---|---|
| Ongoing (Refinanced)2,5 | Alpha REI IV, LLC | Nov. 2009 | $4,330,000 | $1,450,000 | $1,450,000 | $2,946,853 | 915.93% | 19.84% | |
| Alpha REI II, LLC | July 2010 | $10,500,000 | $3,799,800 | $3,799,800 | $5,970,105 | 866.72% | 20.36% | ||
| Alpha REI V, LLC | Nov. 2011 | $4,270,000 | $1,648,800 | $1,648,800 | $2,346,190 | 242.63% | 12.06% | ||
| Alpha REI I, LLC | Sept. 2009 | $14,500,000 | $4,049,800 | $2,668,734 | $4,031,564 | 221.08% | 7.14% | ||
| Alpha REI III, LLC | Nov. 2010 | $9,400,000 | $3,099,000 | $3,099,000 | $3,385,071 | 107.41% | 7.14% | ||
| Alpha REI VI, LLC | Oct. 2012 | $5,925,000 | $1,900,000 | $1,808,366 | $1,272,232 | 170.03% | 7.38% | ||
| TOTAL REFINANCED PROJECTS | $48,925,000 | $15,947,400 | $14,474,700 | $19,952,015 | — | — | |||
| ONGOING4,5 | CCM Income Fund I, LLC | Nov. 2018 | $77,850,000 | $45,299,150 | — | $15,065,458 | 73.83% | 7.31% | |
| TOTAL ONGOING PROJECTS | $126,775,000 | $61,246,550 | $14,474,700 | $35,017,473 | — | — | |||
-
This figure represents the sum of the cumulative distributions made to investors and the amount of the refinance proceeds in excess of original investor capital as of the report date. Quarterly distributions are generally made following the end of each quarter and are recognized in this report as of the date paid.
These investments are closed to new investors and there is no current market for these investments.
The figures appearing in this column have not been independently audited or verified and should not be viewed as an indication of future performance of any other investment.
These entities are continuing to offer units of membership interests ("Units") by means of a private placement memorandum and any supplement thereto (each, a "PPM") in good faith reliance on an exemption from registration with the U.S. Securities & Exchange Commission ("SEC") under Rule 506(b) of SEC Regulation D. The information provided herein does not constitute an offer to sell nor a solicitation of an offer to buy any of the Units. Purchase of Units may be made only by means of the PPM. There is no market for the Units and none is likely to develop and they should be considered illiquid investments. Neither this summary nor the PPM constitutes legal, tax, accounting or investment advice. By receiving this summary, the recipient agrees not to publish, distribute or communicate such information or otherwise use such information in any manner that may constitute general advertising or general solicitation under federal or state securities laws and further agrees to indemnify and hold each entity harmless should it be determined that the person who received this information, by act or omission, facilitated any activity that may constitute use of general solicitation and general advertising in connection with the offer and sale of Units that would make the exemption in Rule 506(b) of the SEC Regulation D unavailable.
These figures reflect the historical performance of an investment in a project from its acquisition date through the report date. Past performance is not indicative of, and does not guarantee, future results.
Cumulative Time-Weighted Return (TWR) and Annualized Time-Weighted Return figures are calculated as of the report date and reflect only distributions paid through that date.

See What’s Next
Discover CCM’s current real estate investment strategy. Contact our team to request information about potential opportunities. We welcome the opportunity to discuss our business, development strategy, and real estate expertise with prospective investors, industry participants, and strategic partners.

*For additional information, please refer to the Important Disclosures section of our website.